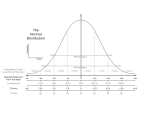
File:Normal distribution and scales.gif

From Citizendium
Jump to navigation Jump to search

Original file(1,200 × 687 pixels, file size: 39 KB, MIME type: image/gif)

This file is from a shared repository and may be used by other projects. The description on its file description page there is shown below.

Transferred from en.wikipedia to Commons by Maksim.

The original description page was here. All following user names refer to en.wikipedia.

Summary

A chart comparing the various grading methods in a normal distribution. Includes: Standard deviations, cumulative percentages, percentile equivalents, Z-scores, T-scores, standard nine, percentage in stanine. Inspired by Figure 4.3 on Page 74 of Ward, A. W., Murray-Ward, M. (1999). Assessment in the Classroom. Belmont, CA: Wadsworth. ISBN 0534527043

Licensing

Public domain I, the copyright holder of this work, release this work into the public domain. This applies worldwide.
In some countries this may not be legally possible; if so:
I grant anyone the right to use this work for any purpose, without any conditions, unless such conditions are required by law.
date/time username edit summary
22:09, 19 December 2005 en:User:Jeremykemp (ISBN)
22:01, 19 December 2005 en:User:Jeremykemp (added reference)
21:53, 19 December 2005 en:User:Jeremykemp (A chart comparing the various grading methods in a normal distribution. Includes: Standard deviations, cummulative precentages, percentile equivalents, Z-scores, T-scores, standard nine, percent in stanine)

Original upload log

Legend: (cur) = this is the current file, (del) = delete this old version, (rev) = revert to this old version.

Click on date to download the file or see the image uploaded on that date.

  • (del) (cur) 21:53, 19 December 2005 . . en:User:Jeremykemp Jeremykemp ( en:User_talk:Jeremykemp Talk) . . 1200x687 (39575 bytes) (A chart comparing the various grading methods in a normal distribution. Includes: Standard deviations, cummulative precentages, percentile equivalents, Z-scores, T-scores, standard nine, percent in stanine)

Captions

Add a one-line explanation of what this file represents

Items portrayed in this file

depicts

File history

Click on a date/time to view the file as it appeared at that time.

Date/TimeThumbnailDimensionsUserComment
current12:12, 20 March 2006Thumbnail for version as of 12:12, 20 March 20061,200 × 687 (39 KB)imagescommonswiki>MaksimLa bildo estas kopiita de wikipedia:en. La originala priskribo estas: == Summary == A chart comparing the various grading methods in a normal distribution. Includes: Standard deviations, cummulative precentages, percentile equivalents, Z-scores, T-scores

The following file is a duplicate of this file (more details):

There are no pages that use this file.