CZ:Statistics: Difference between revisions
imported>Aleksander Stos (→Word count: update) |
imported>Aleksander Stos |
||
| (93 intermediate revisions by 8 users not shown) | |||
| Line 1: | Line 1: | ||
Since its inception (Nov. 2006) and official launch (March 28, 2007), | Since its inception (Nov. 2006) and official launch (March 28, 2007), ''Citizendium'' has grown. This page provides statistics on ''Citizendium''<nowiki></nowiki>'s output of articles and its contributor base.<ref>The graphs have been produced using the publicly available data from the history of edits of all Citizendium pages. Concerning the comparison with the Wikipedia, the "stub-meta-history" dump files were used (see the appropriate [http://download.wikimedia.org/backup-index.html subpages from this index]).</ref> Our meta-discussions take place on the [http://forum.citizendium.org/index.php forum], the relevant statistics page is [http://forum.citizendium.org/index.php?action=stats here]. | ||
| Line 6: | Line 6: | ||
===Number of articles and pages=== | ===Number of articles and pages=== | ||
The first graph shows the number of articles (technically speaking, all pages from mainspace without redirects), including articles that are not "live."<ref>Here we do not count the subpages, but the ''clusters''. We are working on a presentation taking the [[CZ:Subpages|subpages]] into account.</ref> | The first graph shows the number of articles (technically speaking, all pages from mainspace, without redirects and [[CZ:Subpages|subpages]]), including articles that are not "live."<ref>Here we do not count the subpages, but the ''clusters''. We are working on a presentation taking the [[CZ:Subpages|subpages]] into account.</ref> | ||
{{Image|Number_of_articles.png|center|600px|Fig. 1. Number of articles}} | |||
The second graph shows number of all pages from all namespaces (e.g. userpages, talk pages and images are included, redirects are | The second graph shows number of all pages from all namespaces (e.g. userpages, talk pages and images are included, redirects are ''not''). This is the green line. The blue line is the one from the first graph (i.e. the mainspace pages). What made the greeen line jump almost vertically mid February 2007? It was Saint Valentine's, when after ''slashdotting'' many new users registered and were welcomed on their talk pages. Notice that at the same time there was no parallel growth in the mainspace. Apparently, the newly registered users were mainly watching, since at that time there was no unregistered access. A more stable growth rate has been established after the launch. | ||
{{Image|Number_of_all_pages.png|center|600px|Fig. 2. Number of all pages from all namespaces (green) and articles (blue). }} | |||
===Rate of article and page creation=== | ===Rate of article and page creation=== | ||
The third and fourth figure present | The third and fourth figure present ''global creation rate''. It measures the activity on the wiki expressed in new pages per day. The rate for "pure" articles (technically: mainspace without redirects) is depicted in blue; the green line corresponds to all pages (still, without redirects). This is calculated as the number of articles (pages, respectively) divided by the number of working days from the beginning. Obviously, this is a "global average", to be compared with a ''recent'' creation rate on the 5th graph of this section. It represents the creation rate for articles taking into account last 30 days only. | ||
{{Image|Creation_rate_main.png|center|600px|Fig. 3. Creation rate (articles per day)}} | |||
{{Image|Creation_rate_all.png|center|600px|Fig. 4. Overall creation rate in pages per day (green line); the blue line corresponds to articles' creation rate}} | |||
Figure 5 indicates | Figure 5 indicates ''recent'' creation rate. But it needs special explanation. In the earliest months of the project, the ''Citizendium'' was a "fork" of Wikipedia, i.e., we had uploaded all Wikipedia articles. Then, in mid-January 2007, the project's participants decided to "unfork," that is to delete all articles that were not tagged "live" i.e. improved or meant to be improved soon here on CZ. If an article appears to be created before that moment it means that it survived the "Big Unfork" procedure and the 'creation' date is in fact that of its first revision on CZ. | ||
In other words, the growing rate before mid-January is not very meaningful as the rules then were different and putting a tag or just correcting a typo 'created' an article. In the mid-January the article creation statistic plummeted to four articles per day--which was probably a better indicator of the rate at which we were creating our own new content. | In other words, the growing rate before mid-January is not very meaningful as the rules then were different and putting a tag or just correcting a typo 'created' an article. In the mid-January the article creation statistic plummeted to four articles per day--which was probably a better indicator of the rate at which we were creating our own new content. | ||
There was a spike in February 2007 because of a self-registration period and then again in April-May 2007 because of our public launch and the accompanying publicity. There was a spike in November 2007 for three reasons: a press release, a "Stub Week" initiative, and (especially) a very broadly-distributed call for participation made to persons with unused ''Citizendium'' accounts. December 2007 experienced a relative lull no doubt largely on account of the holidays | There was a spike in February 2007 because of a self-registration period and then again in April-May 2007 because of our public launch and the accompanying publicity. There was a spike in November 2007 for three reasons: a press release, a "Stub Week" initiative, and (especially) a very broadly-distributed call for participation made to persons with unused ''Citizendium'' accounts. December 2007 experienced a relative lull no doubt largely on account of the holidays. | ||
{{Image|Recent_creation_rate_main.png|center|600px|Fig. 5. Recent creation rate (last 30 days counted)}} | |||
===Edits daily=== | ===Edits daily=== | ||
The number of edits is highly variable from one day to another | The number of edits is highly variable from one day to another. More meaningful is the 30 days ''moving'' average<ref>That is the average calculated for every day, taking into account the 29 preceding days.</ref> depicted below. Trends are easily visible. The price for readability is a little shift from the actual events: the changes on graph appear a few days after it happened. For example the impact of the launch that occurred in March 2007 can be observed here a bit later. | ||
The graph takes into account edits in all namespaces | The graph takes into account edits in all namespaces. | ||
{{Image|Editsbyday30.png|center|600px|Fig. 5a. Edits by day, 30 days moving average.}} | |||
==Human resources== | ==Human resources== | ||
===Number of authors=== | ===Number of authors=== | ||
The following graphs describe the CZ human resources. These graphs need clarification, because in the months leading up to February 2006, all new authors had to create their own bios, and | The following graphs describe the CZ human resources. These graphs need clarification, because in the months leading up to February 2006, all new authors had to create their own bios, and many new people did that and then nothing else. The Jan.-Feb. 2006 spike is due to a two-week period in which we allowed self-registration. There was also a spike that lasted from the end of March through May 2006, which corresponded to our public launch and the PR blitz that followed. The numbers from June 2006 on are perhaps a better indicator of long-term personnel trends on the wiki. | ||
* How many authors are active each month? The Fig. 6 presents the number of users that made at least one edit (separately for each month). | * How many authors are active each month? The Fig. 6 presents the number of users that made at least one edit (separately for each month). | ||
{{Image|Editing_users.png|center|600px|Fig. 6. Editing authors}} | |||
* How many users get more involved? Fig. 7. shows how many authors make at least 20 (at | * How many users get more involved? Fig. 7. shows how many authors make at least 20 (at least 100, resp.) edits per month. | ||
{{Image|Active_users.png|center|600px|Fig. 7. Active authors}} | |||
===Daily contributors=== | ===Daily contributors=== | ||
How many contributors you | How many contributors could you meet here daily, on average? While correlated with other human resources measures, this one seems to be interesting since it shows how many people make the community on a daily basis. See the figure below. | ||
{{Image|Users_daily.png|center|600px|Fig. 8. Authors daily}} | |||
===New arrivals=== | ===New arrivals=== | ||
Fig. 9: How many new authors arrive each month? This can be measured by counting new user pages. More substantial metric would be, however, to detect a new user on his first edit. Notice that in the period of self-registration (essentially, one week in January and two weeks in February 2007) the two metric largely coincide, as the new users were supposed to provide their bio. There was also a spike in March, which continued into April, due to our launch. New arrivals have been almost exclusively the result of press coverage, of which there has been relatively little over the summer, since our public launch. There were also fewer arrivals in the summer, probably due to the lower amount of academic activity generally. | Fig. 9: How many new authors arrive each month? This can be measured by counting new user pages. More substantial metric would be, however, to detect a new user on his first edit. Notice that in the period of self-registration (essentially, one week in January and two weeks in February 2007) the two metric largely coincide, as the new users were supposed to provide their bio. There was also a spike in March, which continued into April, due to our launch. New arrivals have been almost exclusively the result of press coverage, of which there has been relatively little over the summer, since our public launch. There were also fewer arrivals in the summer, probably due to the lower amount of academic activity generally. | ||
{{Image|New_users.png|center|600px|Fig. 9. New arrivals}} | |||
<!-- | |||
===Comparison to other wikis=== | ===Comparison to other wikis=== | ||
How does the statistical data shed light on Citizendium's strength in terms of human resources? Since April 2007 is the first month after the wiki's official launch, it is instructive to compare Citizendium with several active projects to similar size and mission. In the chart below, Citizendium is compared to several language Wikipedias. This analysis counts the registered users of each site.<ref>Although the analysis excludes IP anonymous users, globally such users | How does the statistical data shed light on Citizendium's strength in terms of human resources? Since April 2007 is the first month after the wiki's official launch, it is instructive to compare Citizendium with several active projects to similar size and mission. In the chart below, Citizendium is compared to several language Wikipedias. This analysis counts the registered users of each site.<ref>Although the analysis excludes IP anonymous users, globally such users do not make too many edits (8-15%, depending on the wiki) and rarely an IP is really active (makes more than 20 edits). Excluding those active IPs is somewhat compensated by the fact that, for the sake of simplicity, we count Wikipedia 'robots' as regular users.</ref> | ||
{{Image|Czwp_comparison.png|center|600px|Fig. 10. CZ - WP human resources comparison}} | |||
As of April 2007, the human resources of CZ are comparable to resources of these Wikipedias from the category "more than 25,000 entries" <ref>As listed on the Main Page of the [http://en.wikipedia.org English Wikipedia]</ref>. For example, CZ would be of the same order of magnitude as hr.wikipedia.org, lt.wikipedia.org, sl.wikipedia.org (these were slightly smaller) or sr.wikipedia.org (this one was a bit bigger than CZ). As a sidenote, there were not many active IP anons on these wikis (about 10; not counted here), roughly as many as robots (here, taken into account). Notice also that there were 24 Wikipedias altogether in the categories "more than 50000", "more than 100000" and "more than 250000" entries. | As of April 2007, the human resources of CZ are comparable to resources of these Wikipedias from the category "more than 25,000 entries" <ref>As listed on the Main Page of the [http://en.wikipedia.org English Wikipedia]</ref>. For example, CZ would be of the same order of magnitude as hr.wikipedia.org, lt.wikipedia.org, sl.wikipedia.org (these were slightly smaller) or sr.wikipedia.org (this one was a bit bigger than CZ). As a sidenote, there were not many active IP anons on these wikis (about 10; not counted here), roughly as many as robots (here, taken into account). Notice also that there were 24 Wikipedias altogether in the categories "more than 50000", "more than 100000" and "more than 250000" entries. | ||
==Development in May== | |||
Here are some statistics regarding CZ's activity in May (a comparison between 1 | Here are some statistics regarding CZ's activity in May (a comparison between 1 | ||
May and 1 June). | May and 1 June). | ||
| Line 113: | Line 114: | ||
As of end of July, 2007, Citizendium contained about 4100K words in its articles. | As of end of July, 2007, Citizendium contained about 4100K words in its articles. | ||
We do not count the tables, nor "infoboxes". Technical | We do not count the tables, nor "infoboxes". Technical information, as e.g. categories or http links are not counted. Draft pages are excluded. | ||
A ''typical'' article was about 562 words long. In fact, this is the [[median]] size, which means that, at the time, half of our articles were longer. There were about 3170 [[CZ:Cluster|clusters]]. | |||
A | A cluster means here the main article with a set of subpages describing given subject (this is the basic unit of Citizendium). The difference between the numbers shown here and the [[:Category:CZ Live|{{PAGESINCAT:CZ Live}} total articles]] displayed on the [[Welcome to Citizendium|Welcome Page]] is that the latter count includes neither [[CZ:The_Article_Checklist#The_.27status.27_field_-_Article_status|external articles]] nor articles without [[CZ:Metadata|metadata]] (which are typically [[CZ:Lemma|lemma articles]], i.e. containing just a short definition or description of the subject). Note also that for computing the median size only the main (or base) page of each cluster (without any subpages) is taken into account. | ||
| Line 153: | Line 155: | ||
| September, 2008 ||8930K || 7.4K || 9673 || 435 || 308 | | September, 2008 ||8930K || 7.4K || 9673 || 435 || 308 | ||
|- | |- | ||
| October, 2008 ||9120K || 6.3K || 10042 || 369 || 301 | | October, 2008 || 9120K || 6.3K || 10042 || 369 || 301 | ||
|- | |- | ||
| November, 2008 || 9370K || 8.3K || 10543 || 501 || 291 | | November, 2008 || 9370K || 8.3K || 10543 || 501 || 291 | ||
| Line 164: | Line 166: | ||
|- | |- | ||
|March, 2009 || 10044K || 5.5K || 12035 || 407 || 265 | |March, 2009 || 10044K || 5.5K || 12035 || 407 || 265 | ||
|- | |||
|April, 2009 || 10218K || 5.8K || 12265 || 230 || 266 | |||
|- | |||
|May, 2009 || 10540K || 10.7K || 12706 || 441 || 264 | |||
|- | |||
|June, 2009 || 10677K || 4.6K || 13137 || 431 || 258 | |||
|- | |||
|July, 2009 || 10998K || 10.7K || 13789 || 652 || 245 | |||
|- | |||
|August, 2009 || 11.238M || 8K || 14617 || 828 || 232 | |||
|- | |||
|September, 2009 || 11.513M || 9.2K || 15176 || 559 || 224 | |||
|- | |||
|October, 2009 || 11.730M || 7.2K || 15882 || 706 || 213 | |||
|- | |||
|November, 2009 || 11.887M || 5.2K || 16687 || 805 || 198 | |||
|- | |||
|December, 2009 || 12.013M || 4.2K || 17072 || 385 || 193 | |||
|- | |||
|January, 2010 || 12.140M || 4.2K || 17750 || 678 || 184 | |||
|- | |||
|February, 2010 || 12.286M|| 4.9K || 18303 || 553 || 176 | |||
|- | |||
|March, 2010 || 12.517M || 7.7K || 18994 || 691 || 169 | |||
|- | |||
|April, 2010 || 12.684M || 5.6K || 20036 || 1042 || 155 | |||
|- | |||
|May, 2010 || 12.808M || 5.3K || 20510 || 474 || 151 | |||
|- | |||
||June, 2010 || 12.903M || 3.1K || 20792 || 282 || 149 | |||
|- | |||
||July, 2010 || 13.012M || 3.6K || 21203 || 411 || 147 | |||
|- | |||
||August, 2010 || 13.150M || 4.6K || 21743 || 540 || 146 | |||
|- | |||
||September, 2010 || 13.245M || 3.2K || 22051 || 308 || 145 | |||
|- | |||
||October, 2010 || 13.347M ||3.4 K || 22363 || 312 || 144 | |||
|- | |||
||November, 2010 || 13.469M || 4.1K || 22821 || 458 || 140 | |||
|- | |||
||December, 2010 || 13.544M|| 2.5 K || 23050 || 229 || 140 | |||
|- | |||
||January, 2011 || 13.662M|| 3.9 K || 23310 || 260 || 140 | |||
|- | |||
||February, 2011 || 13.731M|| 2.3 K || 23497 || 187 || 139 | |||
|- | |||
||March, 2011 || 13.803M|| 2.4K || 23656 || 159 || 139 | |||
|- | |||
||April, 2011 || 13.834M|| 1.0K || 23826 || 170 || 138 | |||
|- | |||
||May, 2011 || 13.875M|| 1.4K || 23907 || 81 || 138 | |||
|- | |||
||June, 2011 || 13.927M|| 1.7K || 23967 || 60 || 138 | |||
|- | |||
||July, 2011 || 13.945M|| 0.6K || 24002 || 35 || 138 | |||
|- | |||
||August, 2011 || 13.973M|| 0.9K || 24053 || 51 || 138 | |||
|- | |||
||September, 2011 || 13.993M|| 0.7K || 24092 || 39 || 138 | |||
|- | |||
||October, 2011 || 14.026M || 1.1K || 24162 || 70 || 138 | |||
|- | |||
||November, 2011 || 14.051M || 0.8K || 24209 || 47 || 138 | |||
|- | |||
||December, 2011 || 14.061M || 0.3K || 24239 || 30 || 138 | |||
|- | |||
||January 2012 || 14.079M || 0.5K || 24265 || 26 || 138 | |||
|- | |||
||February 2012 || 14.110M || 1.0K || 24298 || 33 || 138 | |||
|- | |||
||March 2012 || 14.140M || 1.0K || 24332 || 34 || 138 | |||
|- | |||
||April 2012 || 14.170M || 1.0K || 24365 || 33 || 138 | |||
|- | |||
||May 2012 || 14.227M || 1.9K || 24419 || 54 || 138 | |||
|- | |||
||June 2012 || 14.254M || 0.9K || 24447 || 28 || 138 | |||
|- | |||
||July 2012 || 14.265M || 0.4K || 24463 || 16 || 138 | |||
|- | |||
||August 2012 || 14.284M || 0.6K || 24472 || 9 || 138 | |||
|- | |||
||September 2012 || 14.310M || 0.8K || 24502 || 30 || 139 | |||
|- | |||
||October 2012 || 14.324M || 0.5K || 24537 || 35 || 139 | |||
|- | |||
||November 2012 || 14.356M || 1.1K || 24582 || 45 || 139 | |||
|- | |||
|| December 2012 || 14.381M || 0.8K || 24609 || 27 || 139 | |||
|- | |||
|| January 2013 || 14.414M || 1.1K || 24642 || 33 || 139 | |||
|- | |||
|| February 2013 || 14.430M || 0.5K || 24664 || 22 || 139 | |||
|- | |||
|| March 2013 || 14.460M || 1.0K || 24693 || 29 || 140 | |||
|- | |||
|| April 2013 || 14.507M || 1.6K || 24719 || 26 || 140 | |||
|- | |||
|| May 2013 || 14.513M || 0.2K || 24731 || 12 || 140 | |||
|- | |||
|| June 2013 || 14.527M || 0.5K || 24744 || 13 || 140 | |||
|- | |||
|| July 2013 || 14.561M || 1.1K || 24767 || 23 || 141 | |||
|- | |||
|| August 2013 || 14.823M || 8.7K || 24769 || 2 || 141 | |||
|- | |||
|| September 2013 || 15.045M || 7.4K || 24806 || 37 || 140 | |||
|- | |||
|| October 2013 || 15.039M || -0.2K || 24800 || -6 || 140 | |||
|- | |||
|| November 2013 || 15.048M || 0.3K || 24843 || 43 || 140 | |||
|- | |||
|| December 2013 || 15.071M || 0.8K || 24891 || 48 || 140 | |||
|- | |||
|| January 2014 || 15.088M || 0.6K || 24929 || 38 || 140 | |||
|- | |||
|| February 2014 || 15.101M || 0.4K || 24961 || 32 || 141 | |||
|- | |||
|| March 2014|| 15.109M || 0.3K || 25002 || 41 || 141 | |||
|- | |||
|| April 2014 || 15.119M || 0.3K || 25044 || 42 || 141 | |||
|- | |||
|| May 2014 || 15.128M || 0.3K || 25070 || 26 || 142 | |||
|- | |||
|| June 2014 || 15.143M || 0.5K || 25097 || 27 || 142 | |||
|- | |||
|| July 2014|| 15.152M || 0.3K || 25115 || 18 || 142 | |||
|- | |||
|| August 2014 || 15.154M || 0.1K || 25132 || 17 || 142 | |||
|- | |||
|| September 2014 || 15.194M || 1.3K || 25151 || 19 || 142 | |||
|- | |||
|| October 2014 || 15.200M || 0.2K || 25167 || 16 || 142 | |||
|} | |} | ||
<!-- | <!-- Date || Total Words || Words per day || Clusters || Cluster increase || Median length in words | ||
Date || Total Words || Words per day || Clusters || Cluster increase || Median length in words | |||
--> | --> | ||
==Structure of articles and workgroups== | ==Structure of articles and workgroups== | ||
===Checklisted articles=== | ===Checklisted articles=== | ||
Recall that we categorize the articles as follows | Recall that we categorize the articles as follows | ||
| Line 179: | Line 314: | ||
* Approved (that's it!) | * Approved (that's it!) | ||
{{Image|Checklisted.png|center|600px|Structure of articles.}} | |||
And this is, approximately, how it evolved in time. | |||
[[Image:ChecklistedDynamics.gif|center|Evolutions of structure of articles.]] | |||
===Articles by workgroup=== | ===Articles by workgroup=== | ||
{{Image|Workgroups.png|center|800px|Articles by workgroups}} | |||
...and how it came to this | |||
[[Image:WorkgroupsDynamics.gif|center|Articles by workgroups, progress in time]] | |||
===Members by workgroup=== | ===Members by workgroup=== | ||
{{Image|Cz-authors.png|center|800px|Authors}} | |||
{{Image|Editors.png|center|800px|Registered editors}} | |||
===Progress in time=== | ===Progress in time=== | ||
| Line 208: | Line 354: | ||
[[Image:Prog_7.png|thumb|center|600px]] | [[Image:Prog_7.png|thumb|center|600px]] | ||
==Share button usage== | |||
''See [[CZ:AddThis_Tracking_Statistics]].'' | |||
==Notes== | ==Notes== | ||
Latest revision as of 15:08, 4 November 2014
Since its inception (Nov. 2006) and official launch (March 28, 2007), Citizendium has grown. This page provides statistics on Citizendium's output of articles and its contributor base.[1] Our meta-discussions take place on the forum, the relevant statistics page is here.
Pages
Number of articles and pages
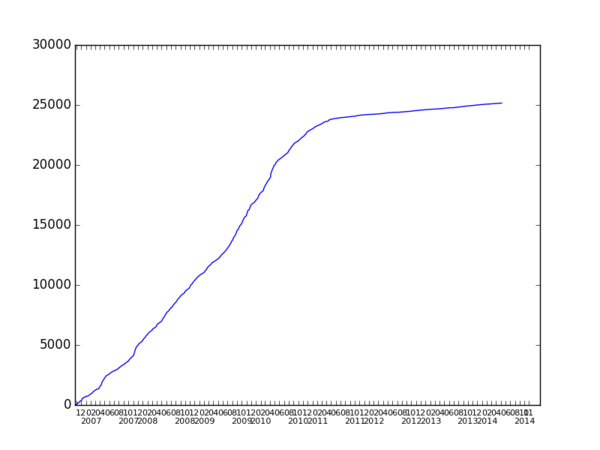
The first graph shows the number of articles (technically speaking, all pages from mainspace, without redirects and subpages), including articles that are not "live."[2]
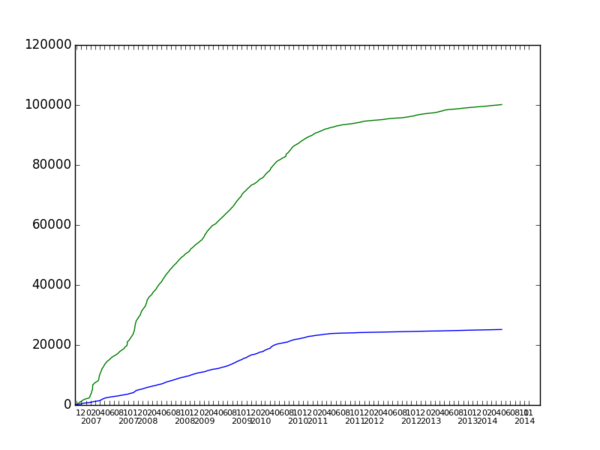
The second graph shows number of all pages from all namespaces (e.g. userpages, talk pages and images are included, redirects are not). This is the green line. The blue line is the one from the first graph (i.e. the mainspace pages). What made the greeen line jump almost vertically mid February 2007? It was Saint Valentine's, when after slashdotting many new users registered and were welcomed on their talk pages. Notice that at the same time there was no parallel growth in the mainspace. Apparently, the newly registered users were mainly watching, since at that time there was no unregistered access. A more stable growth rate has been established after the launch.
Rate of article and page creation
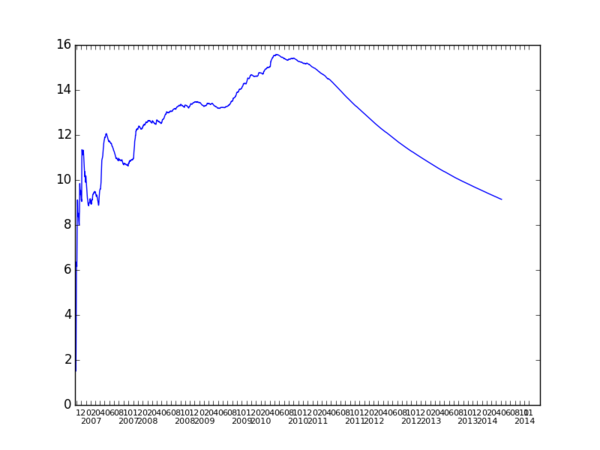
The third and fourth figure present global creation rate. It measures the activity on the wiki expressed in new pages per day. The rate for "pure" articles (technically: mainspace without redirects) is depicted in blue; the green line corresponds to all pages (still, without redirects). This is calculated as the number of articles (pages, respectively) divided by the number of working days from the beginning. Obviously, this is a "global average", to be compared with a recent creation rate on the 5th graph of this section. It represents the creation rate for articles taking into account last 30 days only.
Figure 5 indicates recent creation rate. But it needs special explanation. In the earliest months of the project, the Citizendium was a "fork" of Wikipedia, i.e., we had uploaded all Wikipedia articles. Then, in mid-January 2007, the project's participants decided to "unfork," that is to delete all articles that were not tagged "live" i.e. improved or meant to be improved soon here on CZ. If an article appears to be created before that moment it means that it survived the "Big Unfork" procedure and the 'creation' date is in fact that of its first revision on CZ. In other words, the growing rate before mid-January is not very meaningful as the rules then were different and putting a tag or just correcting a typo 'created' an article. In the mid-January the article creation statistic plummeted to four articles per day--which was probably a better indicator of the rate at which we were creating our own new content.
There was a spike in February 2007 because of a self-registration period and then again in April-May 2007 because of our public launch and the accompanying publicity. There was a spike in November 2007 for three reasons: a press release, a "Stub Week" initiative, and (especially) a very broadly-distributed call for participation made to persons with unused Citizendium accounts. December 2007 experienced a relative lull no doubt largely on account of the holidays.
Edits daily
The number of edits is highly variable from one day to another. More meaningful is the 30 days moving average[3] depicted below. Trends are easily visible. The price for readability is a little shift from the actual events: the changes on graph appear a few days after it happened. For example the impact of the launch that occurred in March 2007 can be observed here a bit later. The graph takes into account edits in all namespaces.
Human resources
Number of authors
The following graphs describe the CZ human resources. These graphs need clarification, because in the months leading up to February 2006, all new authors had to create their own bios, and many new people did that and then nothing else. The Jan.-Feb. 2006 spike is due to a two-week period in which we allowed self-registration. There was also a spike that lasted from the end of March through May 2006, which corresponded to our public launch and the PR blitz that followed. The numbers from June 2006 on are perhaps a better indicator of long-term personnel trends on the wiki.
- How many authors are active each month? The Fig. 6 presents the number of users that made at least one edit (separately for each month).
- How many users get more involved? Fig. 7. shows how many authors make at least 20 (at least 100, resp.) edits per month.
Daily contributors
How many contributors could you meet here daily, on average? While correlated with other human resources measures, this one seems to be interesting since it shows how many people make the community on a daily basis. See the figure below.
New arrivals
Fig. 9: How many new authors arrive each month? This can be measured by counting new user pages. More substantial metric would be, however, to detect a new user on his first edit. Notice that in the period of self-registration (essentially, one week in January and two weeks in February 2007) the two metric largely coincide, as the new users were supposed to provide their bio. There was also a spike in March, which continued into April, due to our launch. New arrivals have been almost exclusively the result of press coverage, of which there has been relatively little over the summer, since our public launch. There were also fewer arrivals in the summer, probably due to the lower amount of academic activity generally.
Word count
The table below is based on database dumps made about the end of every month. The following example explains its content.
As of end of July, 2007, Citizendium contained about 4100K words in its articles. We do not count the tables, nor "infoboxes". Technical information, as e.g. categories or http links are not counted. Draft pages are excluded. A typical article was about 562 words long. In fact, this is the median size, which means that, at the time, half of our articles were longer. There were about 3170 clusters.
A cluster means here the main article with a set of subpages describing given subject (this is the basic unit of Citizendium). The difference between the numbers shown here and the 16,467 total articles displayed on the Welcome Page is that the latter count includes neither external articles nor articles without metadata (which are typically lemma articles, i.e. containing just a short definition or description of the subject). Note also that for computing the median size only the main (or base) page of each cluster (without any subpages) is taken into account.
| Date | Total Words | Words per day | Clusters | Cluster increase | Median length in words |
|---|---|---|---|---|---|
| July, 2007 | 4100K | N/A | 3170 | N/A | 562 |
| August, 2007 | 4415K | 10.5K | 3480 | 300 | 551 |
| September, 2007 | 4577K | 5.4K | 3771 | 301 | 511 |
| October, 2007 | 4889K | 10.4K | 4200 | 429 | 468 |
| November, 2007 | 5297K | 13.6K | 5092 | 892 | 385 [4] |
| December, 2007 | 5603K | 10.2K | 5493 | 401 | 369 |
| January, 2008 | 5914K | 10.4K | 6005 | 512 | 350 |
| February, 2008 | 6165K | 8.4K | 6334 | 329 | 344 |
| March, 2008 | 6484K | 10.7K | 6681 | 347 | 339 |
| April, 2008 | 6963K | 16K | 7126 | 445 | 339 |
| May, 2008 | 7744K | 26K | 7716 | 590 | 340 |
| June, 2008 | 8042K | 9.9K | 8185 | 465 | 323 |
| July, 2008[5] | 8375K | 11.1K | 8711 | 526 | 319 |
| August, 2008 | 8708K | 11.1K | 9238 | 527 | 315 |
| September, 2008 | 8930K | 7.4K | 9673 | 435 | 308 |
| October, 2008 | 9120K | 6.3K | 10042 | 369 | 301 |
| November, 2008 | 9370K | 8.3K | 10543 | 501 | 291 |
| December, 2008 | 9589K | 7.3K | 11007 | 464 | 283 |
| January, 2009 | 9748K | 5.3K | 11239 | 232 | 283 |
| February, 2009 | 9878K | 4.3K | 11628 | 389 | 275 |
| March, 2009 | 10044K | 5.5K | 12035 | 407 | 265 |
| April, 2009 | 10218K | 5.8K | 12265 | 230 | 266 |
| May, 2009 | 10540K | 10.7K | 12706 | 441 | 264 |
| June, 2009 | 10677K | 4.6K | 13137 | 431 | 258 |
| July, 2009 | 10998K | 10.7K | 13789 | 652 | 245 |
| August, 2009 | 11.238M | 8K | 14617 | 828 | 232 |
| September, 2009 | 11.513M | 9.2K | 15176 | 559 | 224 |
| October, 2009 | 11.730M | 7.2K | 15882 | 706 | 213 |
| November, 2009 | 11.887M | 5.2K | 16687 | 805 | 198 |
| December, 2009 | 12.013M | 4.2K | 17072 | 385 | 193 |
| January, 2010 | 12.140M | 4.2K | 17750 | 678 | 184 |
| February, 2010 | 12.286M | 4.9K | 18303 | 553 | 176 |
| March, 2010 | 12.517M | 7.7K | 18994 | 691 | 169 |
| April, 2010 | 12.684M | 5.6K | 20036 | 1042 | 155 |
| May, 2010 | 12.808M | 5.3K | 20510 | 474 | 151 |
| June, 2010 | 12.903M | 3.1K | 20792 | 282 | 149 |
| July, 2010 | 13.012M | 3.6K | 21203 | 411 | 147 |
| August, 2010 | 13.150M | 4.6K | 21743 | 540 | 146 |
| September, 2010 | 13.245M | 3.2K | 22051 | 308 | 145 |
| October, 2010 | 13.347M | 3.4 K | 22363 | 312 | 144 |
| November, 2010 | 13.469M | 4.1K | 22821 | 458 | 140 |
| December, 2010 | 13.544M | 2.5 K | 23050 | 229 | 140 |
| January, 2011 | 13.662M | 3.9 K | 23310 | 260 | 140 |
| February, 2011 | 13.731M | 2.3 K | 23497 | 187 | 139 |
| March, 2011 | 13.803M | 2.4K | 23656 | 159 | 139 |
| April, 2011 | 13.834M | 1.0K | 23826 | 170 | 138 |
| May, 2011 | 13.875M | 1.4K | 23907 | 81 | 138 |
| June, 2011 | 13.927M | 1.7K | 23967 | 60 | 138 |
| July, 2011 | 13.945M | 0.6K | 24002 | 35 | 138 |
| August, 2011 | 13.973M | 0.9K | 24053 | 51 | 138 |
| September, 2011 | 13.993M | 0.7K | 24092 | 39 | 138 |
| October, 2011 | 14.026M | 1.1K | 24162 | 70 | 138 |
| November, 2011 | 14.051M | 0.8K | 24209 | 47 | 138 |
| December, 2011 | 14.061M | 0.3K | 24239 | 30 | 138 |
| January 2012 | 14.079M | 0.5K | 24265 | 26 | 138 |
| February 2012 | 14.110M | 1.0K | 24298 | 33 | 138 |
| March 2012 | 14.140M | 1.0K | 24332 | 34 | 138 |
| April 2012 | 14.170M | 1.0K | 24365 | 33 | 138 |
| May 2012 | 14.227M | 1.9K | 24419 | 54 | 138 |
| June 2012 | 14.254M | 0.9K | 24447 | 28 | 138 |
| July 2012 | 14.265M | 0.4K | 24463 | 16 | 138 |
| August 2012 | 14.284M | 0.6K | 24472 | 9 | 138 |
| September 2012 | 14.310M | 0.8K | 24502 | 30 | 139 |
| October 2012 | 14.324M | 0.5K | 24537 | 35 | 139 |
| November 2012 | 14.356M | 1.1K | 24582 | 45 | 139 |
| December 2012 | 14.381M | 0.8K | 24609 | 27 | 139 |
| January 2013 | 14.414M | 1.1K | 24642 | 33 | 139 |
| February 2013 | 14.430M | 0.5K | 24664 | 22 | 139 |
| March 2013 | 14.460M | 1.0K | 24693 | 29 | 140 |
| April 2013 | 14.507M | 1.6K | 24719 | 26 | 140 |
| May 2013 | 14.513M | 0.2K | 24731 | 12 | 140 |
| June 2013 | 14.527M | 0.5K | 24744 | 13 | 140 |
| July 2013 | 14.561M | 1.1K | 24767 | 23 | 141 |
| August 2013 | 14.823M | 8.7K | 24769 | 2 | 141 |
| September 2013 | 15.045M | 7.4K | 24806 | 37 | 140 |
| October 2013 | 15.039M | -0.2K | 24800 | -6 | 140 |
| November 2013 | 15.048M | 0.3K | 24843 | 43 | 140 |
| December 2013 | 15.071M | 0.8K | 24891 | 48 | 140 |
| January 2014 | 15.088M | 0.6K | 24929 | 38 | 140 |
| February 2014 | 15.101M | 0.4K | 24961 | 32 | 141 |
| March 2014 | 15.109M | 0.3K | 25002 | 41 | 141 |
| April 2014 | 15.119M | 0.3K | 25044 | 42 | 141 |
| May 2014 | 15.128M | 0.3K | 25070 | 26 | 142 |
| June 2014 | 15.143M | 0.5K | 25097 | 27 | 142 |
| July 2014 | 15.152M | 0.3K | 25115 | 18 | 142 |
| August 2014 | 15.154M | 0.1K | 25132 | 17 | 142 |
| September 2014 | 15.194M | 1.3K | 25151 | 19 | 142 |
| October 2014 | 15.200M | 0.2K | 25167 | 16 | 142 |
Structure of articles and workgroups
Checklisted articles
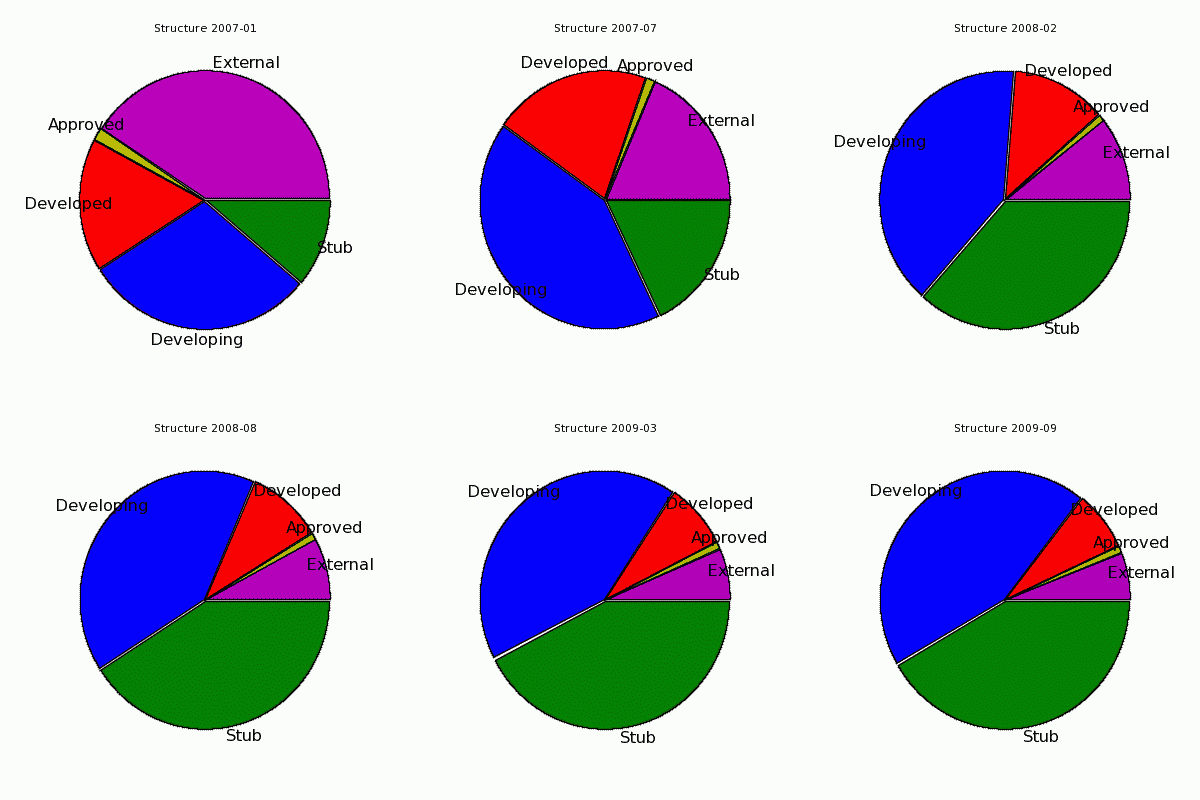
Recall that we categorize the articles as follows
- External (imported and not yet improved)
- Stubs (no more than few sentences)
- Developing (beyond a stub but incomplete)
- Developed (complete or nearly so)
- Approved (that's it!)
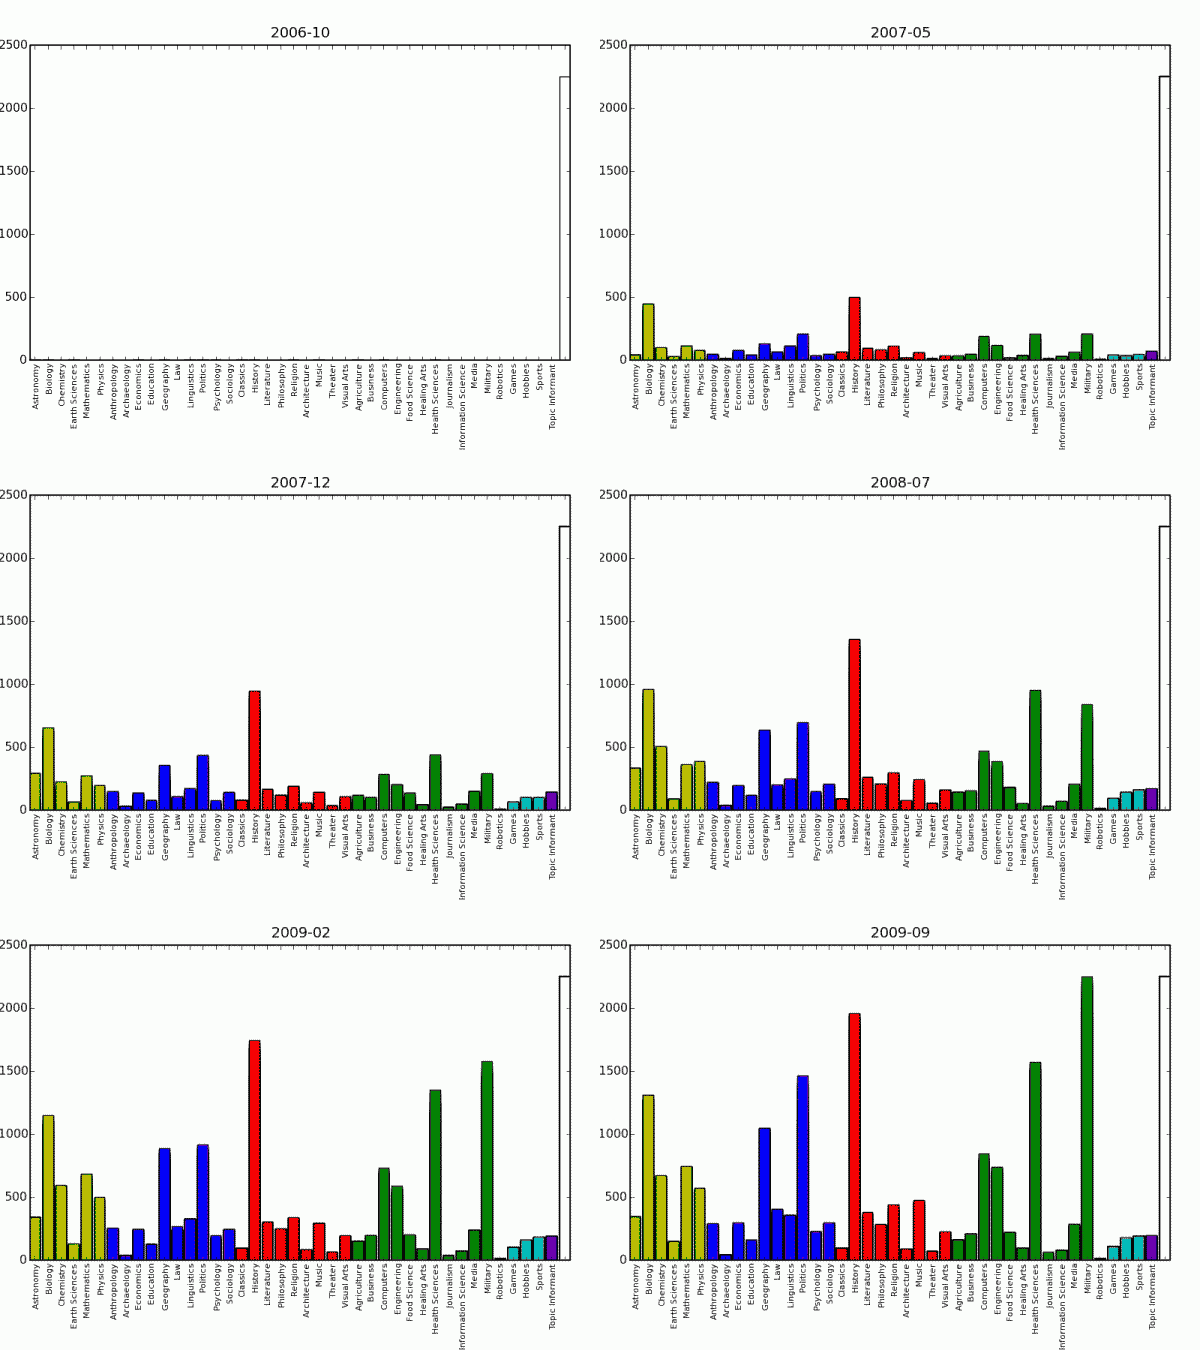
And this is, approximately, how it evolved in time.
Articles by workgroup
...and how it came to this
Members by workgroup
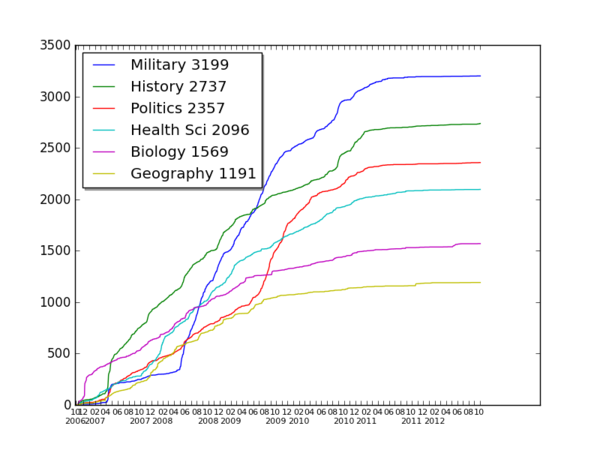
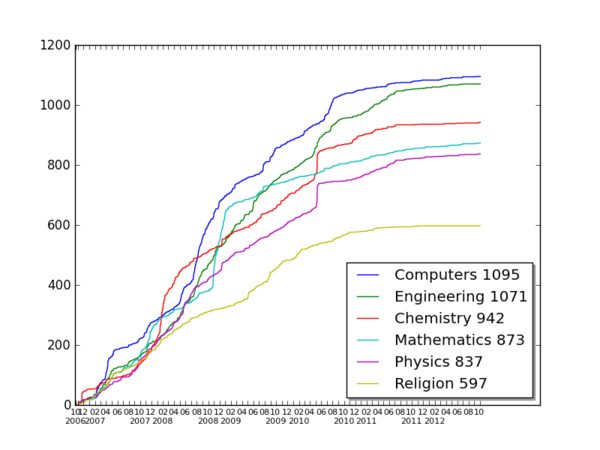
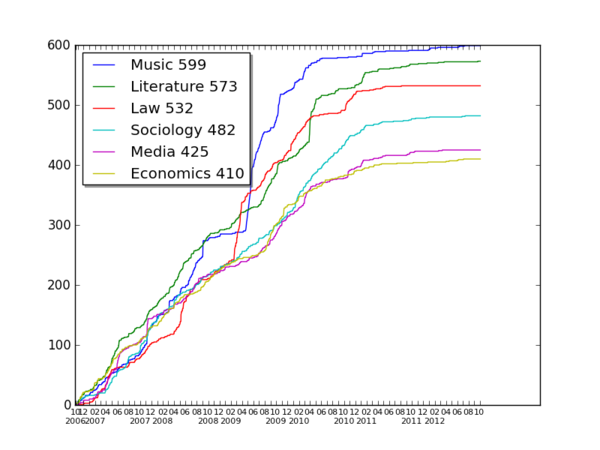
Progress in time
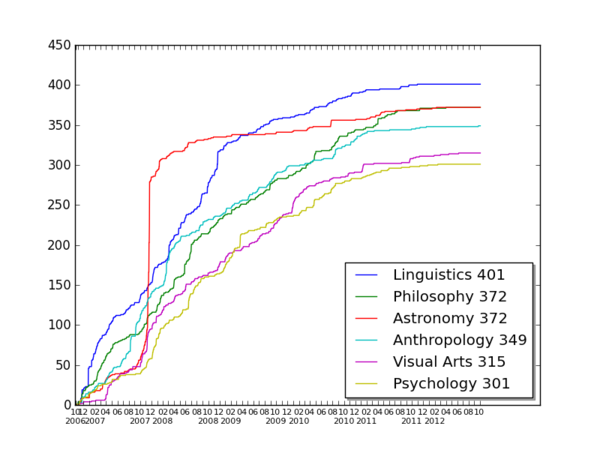
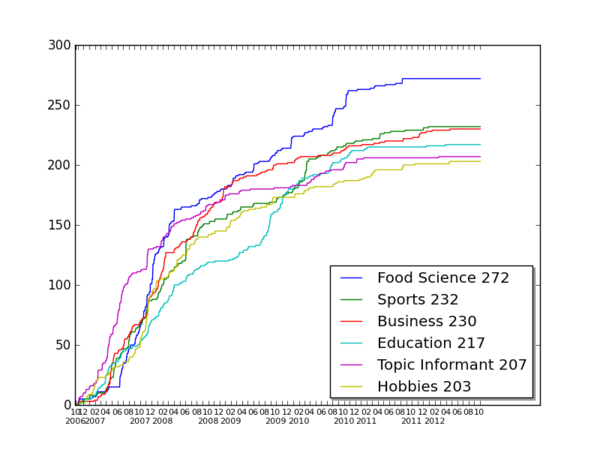
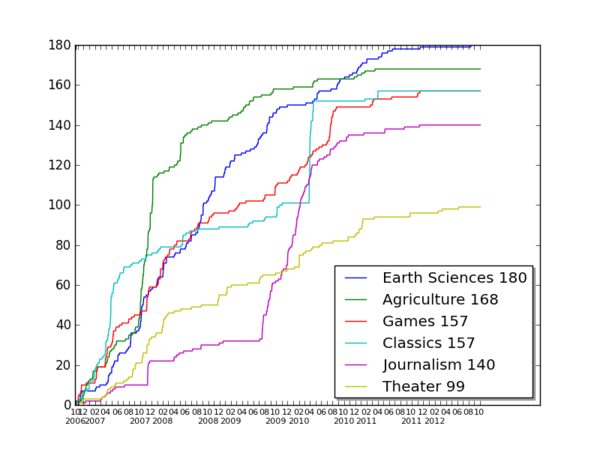
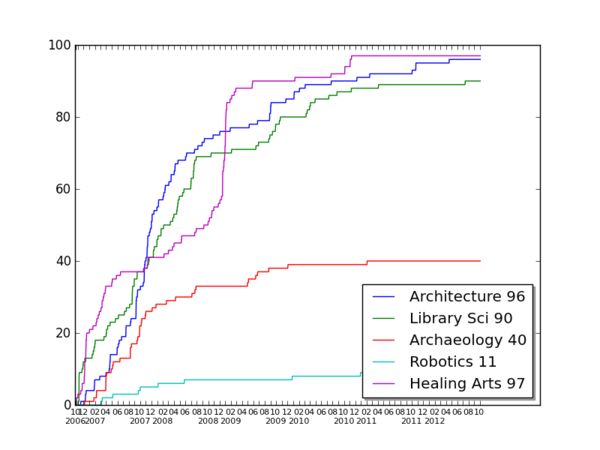
Here we graph the number of articles in various workgroups vs. time.
See CZ:AddThis_Tracking_Statistics.
Notes
- ↑ The graphs have been produced using the publicly available data from the history of edits of all Citizendium pages. Concerning the comparison with the Wikipedia, the "stub-meta-history" dump files were used (see the appropriate subpages from this index).
- ↑ Here we do not count the subpages, but the clusters. We are working on a presentation taking the subpages into account.
- ↑ That is the average calculated for every day, taking into account the 29 preceding days.
- ↑ The high increase in clusters was no doubt due to this blog post.
- ↑ For technical reasons, numbers for July are determined as the mean between June and August
| Citizendium Organization | ||
|---|---|---|
| CZ:Home | Workgroups | Personnel | Governance | Proposals | Recruitment | Contact | Donate | FAQ | Sitemap |
|width=10% align=center style="background:#F5F5F5"| |}
